

Image Details
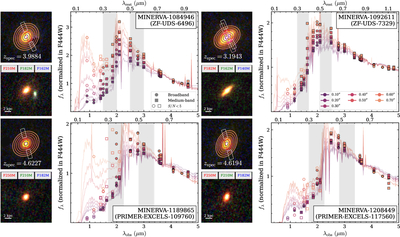
Caption: Figure 1.
Image cutouts and resolved SEDs of the four ultramassive quiescent galaxies. For each galaxy, a (F090W+F115W+F150W)-F277W-F444W RGB image is shown in the top left, while the bottom left shows a medium-band-only RGB image. The three medium-band filters for each galaxy, chosen to span the Balmer/4000 Å break, are indicated at the top of the cutout. A neighboring galaxy is masked in the broadband RGB cutout of MINERVA-1084946. All cutouts are made from mosaics at the native pixel scale and have a dimension of ﹩2\mathop{.}\limits^{^{\prime\prime} }5\times 2\mathop{.}\limits^{^{\prime\prime} }5﹩. Ellipses with colors identical to the SEDs indicate the seven annuli used to measure resolved photometry, while white/red boxes and pink/magenta boxes indicate the NIRSpec MSA slits from C24 and K. Glazebrook et al. (2024), respectively. Resolved photometry of all NIRCam filters in each annulus is shown on the right with colored points, normalized to unity in F444W. Circles indicate archival JWST and HST data, while squares represent the MINERVA suite of medium bands. Open points indicate photometry with S/N < 5. Thin lines show the best-fit EAZY model for each annulus, and gray shaded regions highlight the FWHM of the rest-frame U and V filters. Color gradients are clearly visible in the SEDs corresponding to different annuli.
Other Images in This Article
Copyright and Terms & Conditions
© 2026. The Author(s). Published by the American Astronomical Society.

