

Image Details
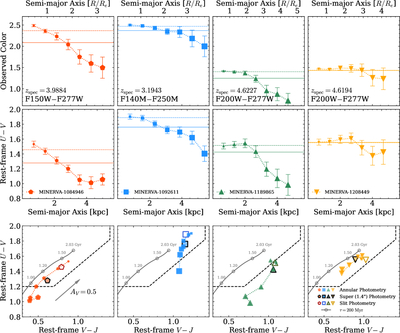
Caption: Figure 2.
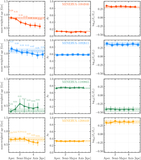
Most of the ultramassive quiescent galaxies at z > 3 have negative color gradients. Top row: change in observed colors with aperture semimajor axis (in kiloparsecs on the bottom axis and relative to the flux radius on the top) for each galaxy in our sample. The filters, chosen to be closest to the pivot wavelength of the rest-frame U and V bands, are indicated in the bottom left of each panel. Filled points (connected via dotted lines) indicate the color in each annulus, with larger-sized points indicating larger radii. Solid lines indicate colors from super aperture photometry (see Section 2), while dashed lines show colors derived from “slit photometry” (photometry measured in rectangular apertures approximating the NIRSpec/G235M slits of C24) with EAZY. Note, both the observed and rest-frame colors of the super and slit photometry are roughly identical for MINERVA-1208449. Middle row: rest-frame U − V color gradients. Symbols are identical to the top row. Bottom row: evolution of annular rest-frame colors within the UVJ diagram. Colored points are identical to the top row. Open points indicate rest-frame colors from slit photometry, while black-outlined points represent colors from super apertures. Apertures closer in size to the isophotal area of the galaxy (e.g., the 1﹩\mathop{.}\limits^{^{\prime\prime} }﹩4 super aperture) are more representative of the entire galaxy, while smaller apertures (e.g., 0﹩\mathop{.}\limits^{^{\prime\prime} }﹩32) can be strongly biased by light from the galactic center. Black dashed lines indicate the UVJ selection for quiescent galaxies at 2 < z < 3.5 from K. E. Whitaker et al. (2011). Dark gray solid lines indicate the rest-frame color evolution of an FSPS model with an exponentially declining SFH that has an e-folding timescale of τ = 200 Myr.
Other Images in This Article
Copyright and Terms & Conditions
© 2026. The Author(s). Published by the American Astronomical Society.

