

Image Details
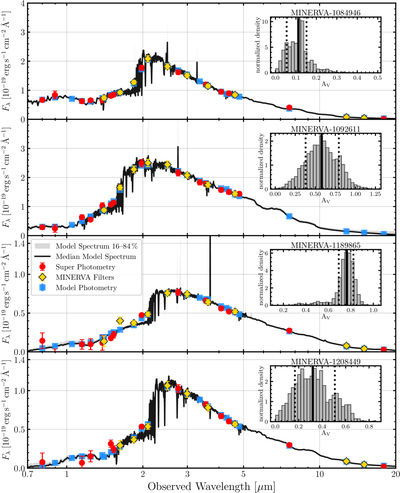
Caption: Figure D1.
Posterior SEDs for each of our ultramassive quiescent galaxies using our PROSPECTOR modeling of the super and MIRI combined photometry. Median model spectra and photometry, as well as their respective 1σ uncertainties, are shown. The observed data are shown in red. Inset are the posterior distributions of AV for each object. The median of each distribution is shown as the vertical solid black line, and the upper and lower 1σ uncertainties are shown as dotted black vertical lines.
Other Images in This Article
Copyright and Terms & Conditions
© 2026. The Author(s). Published by the American Astronomical Society.

Copyright ©
2026 Astronomy Image Explorer. All Rights Reserved.
