

Image Details
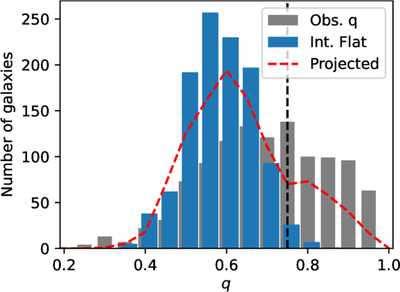
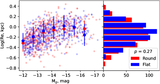
Caption: Figure 9.
Distribution of projected axis ratios for the Virgo dE sample. The observed distribution is shown in gray. The blue histogram represents the assumed intrinsically flat axis-ratio distribution, modeled as a population of triaxial galaxies with median intrinsic axis ratio C/A = 0.6 ± 0.1 and triaxiality T = 0.16 ± 0.05, following the formalism of R. Sánchez-Janssen et al. (2016). The red curve shows the projected axis-ratio distribution obtained from Monte Carlo realizations of the intrinsically flat population viewed from random orientations.
Other Images in This Article
Copyright and Terms & Conditions
© 2026. The Author(s). Published by the American Astronomical Society.

Copyright ©
2026 Astronomy Image Explorer. All Rights Reserved.
