

Image Details
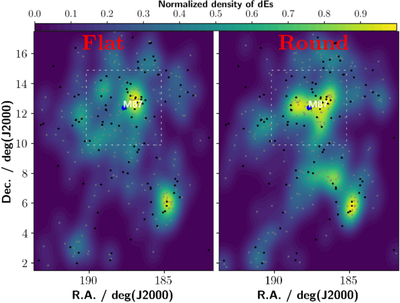
Caption: Figure 6.
Surface number density maps of dEs with available radial velocities in the Virgo Cluster. The symbols and color scheme are the same as in Figure 3. The central 5° × 5° region is highlighted, corresponding to the area used to examine the line-of-sight velocity distributions of flat and round dEs within the cluster core.
Other Images in This Article
Copyright and Terms & Conditions
© 2026. The Author(s). Published by the American Astronomical Society.

Copyright ©
2026 Astronomy Image Explorer. All Rights Reserved.
