

Image Details
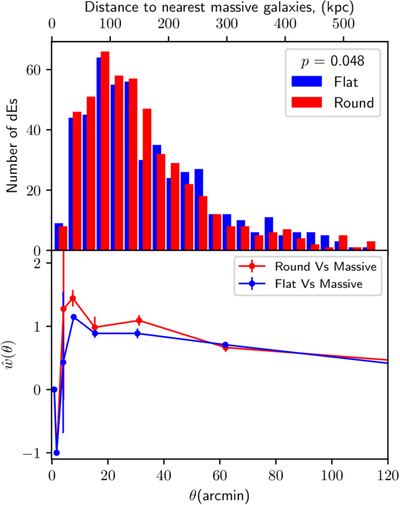
Caption: Figure 4.
Top: distribution of projected distances from each dEs to its nearest massive galaxy. The p-value from the KS test comparing the flat and round dE distributions is indicated in the legend. Bottom: projected two-point cross-correlation functions between dEs and massive galaxies. Round dEs exhibit a stronger clustering signal at small projected separations compared to flat dEs. Error bars are derived from jackknife resampling.
Other Images in This Article
Copyright and Terms & Conditions
© 2026. The Author(s). Published by the American Astronomical Society.

Copyright ©
2026 Astronomy Image Explorer. All Rights Reserved.
