

Image Details
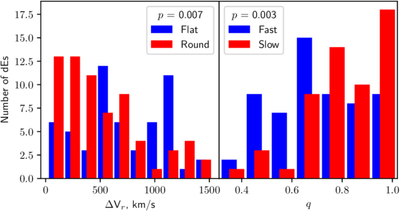
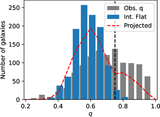
Caption: Figure 7.
Left: distribution of line-of-sight velocities of dEs relative to M87. The vertical dashed lines indicate the velocity thresholds used to define the slow- and fast-moving subsamples. Right: projected axis-ratio distributions of slow and fast dEs, defined as galaxies with relative line-of-sight velocities below 475 km s−1 and above 555 km s−1, respectively. The corresponding KS-test p-value is indicated in the legend. Fast-moving dEs exhibit a larger fraction of flattened systems, whereas slow-moving dEs are preferentially round, consistent with a morphology–kinematics relation within the Virgo Cluster.
Other Images in This Article
Copyright and Terms & Conditions
© 2026. The Author(s). Published by the American Astronomical Society.

