

Image Details
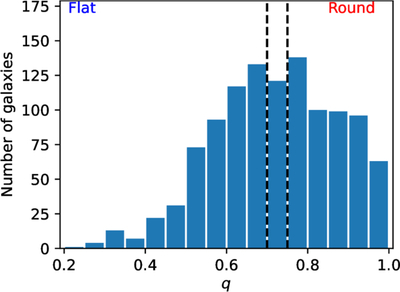
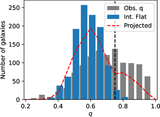
Caption: Figure 2.
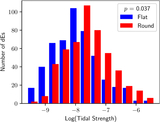
Distribution of axis ratios for the full sample of dEs. The median axis ratio of the sample is q = 0.72. The vertical dashed lines mark the 45th and 55th percentiles of the distribution, which define the boundaries used to classify galaxies by shape. dEs with q < 0.70 are defined as flat, while those with q > 0.74 are defined as round. The intermediate axis ratios between these percentiles are excluded to avoid ambiguous classifications and to ensure a clean separation between flattened and round systems.
Other Images in This Article
Copyright and Terms & Conditions
© 2026. The Author(s). Published by the American Astronomical Society.

Copyright ©
2026 Astronomy Image Explorer. All Rights Reserved.
