

Image Details
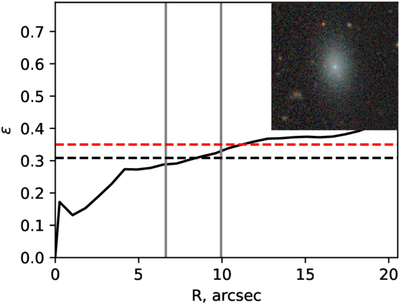
Caption: Figure 1.
Major-axis ellipticity profile of an example dE. The ellipticity profile is derived from isophotal ellipse fitting to the galaxy light distribution. The two vertical gray lines mark 0.75 and 1.25 times the half-light radius of the galaxy, defining the radial range used to measure the representative axis ratio. The horizontal black dashed line indicates the median ellipticity measured within this range. For comparison, the red horizontal dashed line shows the ellipticity reported by the Legacy Survey pipeline. A combined g − r − z tricolor image of the galaxy is shown in the upper-right corner.
Other Images in This Article
Copyright and Terms & Conditions
© 2026. The Author(s). Published by the American Astronomical Society.

Copyright ©
2026 Astronomy Image Explorer. All Rights Reserved.
