

Image Details
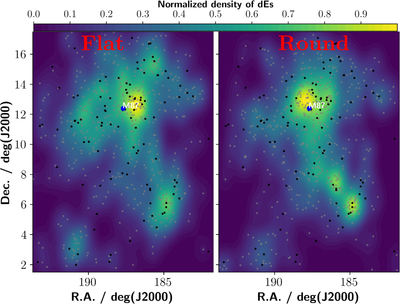
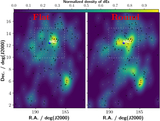
Caption: Figure 3.
Surface number density maps of dEs in the Virgo Cluster. Flat dEs are shown in the left panel and round dEs in the right panel. The maps are constructed using a two-dimensional Gaussian kernel density estimation (KDE) with a kernel width of 0﹩\mathop{.}\limits^{^\circ }﹩175 = 50 kpc. The color bar indicates the normalized surface density. Small gray points represent individual dEs used to generate the density maps, while large black circles mark massive galaxies.
Other Images in This Article
Copyright and Terms & Conditions
© 2026. The Author(s). Published by the American Astronomical Society.

Copyright ©
2026 Astronomy Image Explorer. All Rights Reserved.
