Image Details
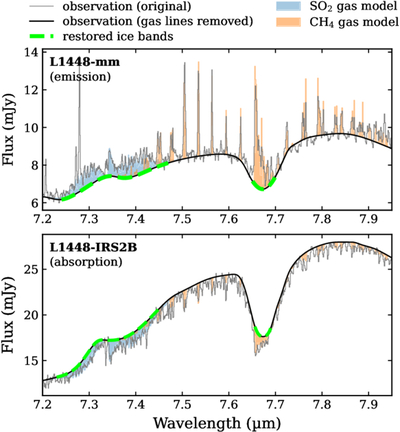
Caption: Figure 5.
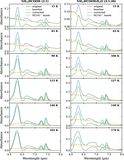
Two examples of how gas-phase lines interfere with the characterization of absorption bands in the COM ice fingerprint range. L1448-mm (top) and L1448-IRS2B (bottom) show the cases of gas-phase lines presented in emission and in absorption, respectively. In each panel, the original observed spectrum and the manually traced baseline of gas-phase lines are plotted in gray and black, respectively. The regions shaded in blue and orange indicate the modeled rovibrational lines of gas-phase SO2 and CH4, respectively. The absorption features contaminated by gas-phase lines are highlighted as dashed green lines.
Other Images in This Article
Copyright and Terms & Conditions
© 2026. The Author(s). Published by the American Astronomical Society.