Image Details
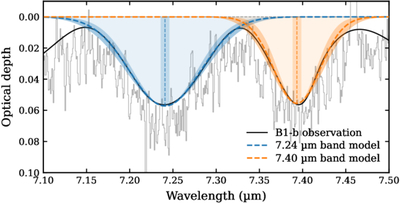
Caption: Figure 1.
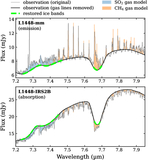
Gaussian fitting of the 7.24 and 7.40 μm bands, taking B1-b as an example. The observations before and after gas-line removal are shown as thin gray and thick black lines, respectively. The shaded regions in blue and orange represent the two Gaussian functions jointly fitted to the 7.24 and 7.40 μm bands, respectively, with the vertical dashed lines marking the centers of the fitted Gaussian components. The darker shaded regions indicate the uncertainties in the peak wavelength (0.005 μm) and FWHM (0.01 μm); see Appendix C for further description of the uncertainty estimation.
Other Images in This Article
Copyright and Terms & Conditions
© 2026. The Author(s). Published by the American Astronomical Society.
Copyright ©
2026 Astronomy Image Explorer. All Rights Reserved.