Image Details
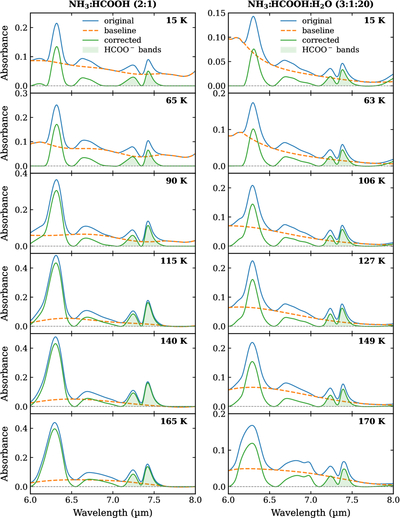
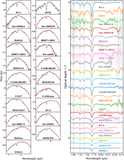
Caption: Figure 7.
Baseline correction of the laboratory IR spectra of two ice mixtures, NH3:HCOOH = 2:1 (left column) and NH3:HCOOH:H2O = 3:1:20 (right column). In each panel, the original and baseline-corrected spectra are plotted in blue and green, respectively. The polynomial baseline is shown as the dashed orange line. The two HCOO− bands of interest are shaded in green. The measurement temperature is indicated in the upper right corner.
Other Images in This Article
Copyright and Terms & Conditions
© 2026. The Author(s). Published by the American Astronomical Society.
Copyright ©
2026 Astronomy Image Explorer. All Rights Reserved.