Image Details
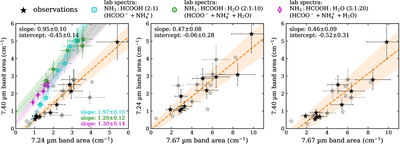
Caption: Figure 3.
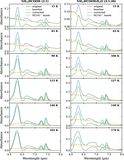
Integrated areas of the three bands at 7.24, 7.4, and 7.67 μm. Values measured from observations are denoted by stellar markers in black or gray; markers in hollow gray and solid gray indicate the observed 7.24 or 7.40 μm bands are in low SNRs and contaminated by the gas-phase lines, respectively. Only the solid points (i.e., those with a robust SNR) were taken into account in the fitting. In each panel, the best linear fit of the observations and its uncertainty are indicated by the dashed line and shaded region in orange, respectively, with the value of the best-fit slope and intercept annotated in the upper left corner. In the left panel, areas of two HCOO− bands at 7.24 and 7.39 μm measured from laboratory spectra at different temperatures (between 15 and ∼170 K, see Table 4) are added for comparison with the observations. Cyan, purple, and green correspond to three HCOO− ices: the pure one and two H2O-mixed ones with different mixing ratios (see the common legend at the top). The shaded regions in these three colors indicate the ranges of laboratory-measured band area ratios of different HCOO− ices, and the slope of the best linear fits is annotated in the lower right corner. The experimental band areas of pure HCOO− ices are scaled by a factor of 2/3 to facilitate the comparison with observational results. The band area uncertainties for the observed and laboratory spectra are set as 20% and 15%, respectively (see the explanations in Appendix C).
Other Images in This Article
Copyright and Terms & Conditions
© 2026. The Author(s). Published by the American Astronomical Society.