Image Details
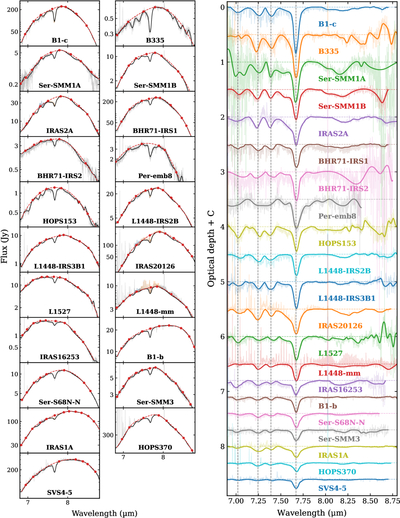
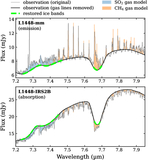
Caption: Figure 6.
Left: local continuum traced between 6.8 and 8.8 μm (dashed red lines) and its guiding points (red dots). The observed spectra before and after removing gas-phase lines are plotted in gray and black, respectively. In the panels of six sources (B1-c, IRAS 2A, L1448-IRS2B, IRAS 20126, L1448-mm, IRAS 1A), the modeled rovibrational transitions of gas-phase SO2 and CH4 are shaded in blue and orange, respectively (see Section A.1 and Figure 5 for details). Right: same as Figure 2 but for the 6.8–8.8 μm region.
Other Images in This Article
Copyright and Terms & Conditions
© 2026. The Author(s). Published by the American Astronomical Society.
Copyright ©
2026 Astronomy Image Explorer. All Rights Reserved.