Image Details
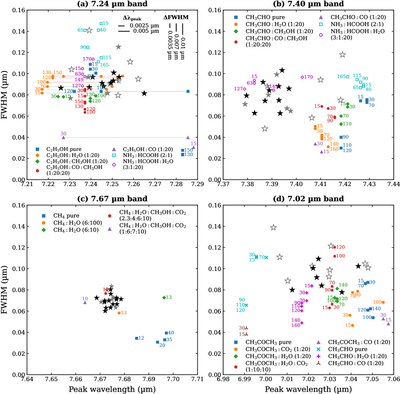
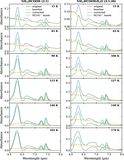
Caption: Figure 4.
Peak wavelength vs. the FWHM of the absorption bands at (a) 7.24 μm, (b) 7.42 μm, (c) 7.67 μm, and (d) 7.02 μm in the JWST/MIRI-MRS spectra and the laboratory spectra of C2H5OH, CH3CHO, and HCOO− ices (labeled as NH3:HCOOH mixtures). Values measured from laboratory spectra are denoted by multi-shape markers in different colors (see legend in each panel), and the number next to each marker indicates the temperature in Kelvin. The laboratory data are taken from J. Terwisscha van Scheltinga et al. (2018) for CH3CHO and C2H5OH, M. G. Rachid et al. (2020) for CH3COCH3, and this work (Appendix D) for HCOO−. The legend convention for observational data points is the same as in Figure 3. In the laboratory spectra of some C2H5OH ice mixtures, the band around 7.24 μm is split into two, which are indicated by two data points linked with dotted lines. To avoid clutter, representative uncertainty bars in peak wavelength (0.0025 and 0.005 μm) and FWHM (0.0035, 0.007, and 0.01 μm) are indicated in the upper right corner of panel (a). The observational data points have Δλpeak = 0.005 μm and ΔFWHM = 0.01 μm; the experimental data points have Δλpeak = 0.0025 μm and ΔFWHM = 0.0035 μm for HCOO− (panels (a), (b)) and CH3COCH3 ices (panel (d)), and Δλpeak = 0.005 μm and ΔFWHM = 0.007 μm for C2H5OH (panel (a)), CH3CHO (panels (b), (d)), and CH4 ices (panel (c)). See Appendix C for the discussion of uncertainty estimation.
Other Images in This Article
Copyright and Terms & Conditions
© 2026. The Author(s). Published by the American Astronomical Society.