Image Details
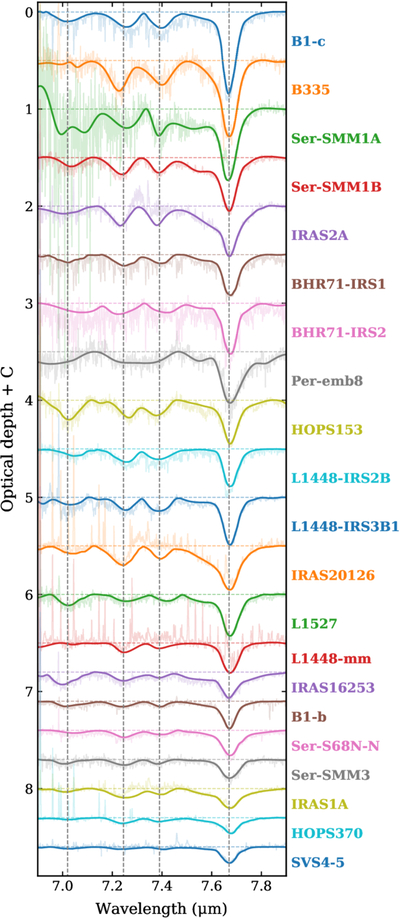
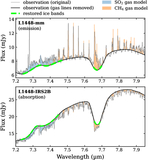
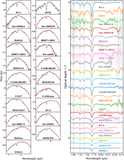
Caption: Figure 2.
Isolated absorption features between 6.9 and 7.9 μm after subtracting the local continuum (and removing the rovibrational lines of gas-phase SO2 and CH4, if necessary). The spectra are displayed from top to bottom in a rough order of the intensity of the CH4 band at 7.67 μm. The spectra plotted in thin and thick lines are the spectra before and after removing the gas-phase lines, respectively. Four vertical dotted lines in gray are plotted at 7.02, 7.245, 7.39, and 7.67 μm, respectively, for comparison with the observed absorption bands.
Other Images in This Article
Copyright and Terms & Conditions
© 2026. The Author(s). Published by the American Astronomical Society.
Copyright ©
2026 Astronomy Image Explorer. All Rights Reserved.