Image Details
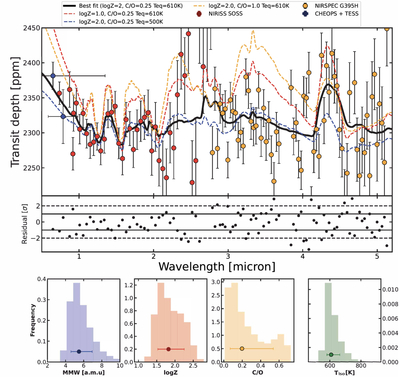
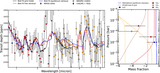
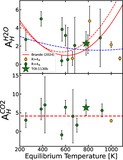
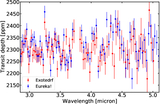
Caption: Figure 3.
JWST/NIRSpec (orange) and NIRISS/SOSS (red) transmission spectrum of TOI-1130 b. The blue points show the transit depths derived from TESS and CHEOPS discussed in Section 3.3. The derivation of the JWST transmission spectra is discussed in Section 3.2. The error bars shown for the observed spectra have been scaled up by the fitted jitter term from the equilibrium chemistry retrieval. The best-fit model has ﹩{\chi }_{\nu }^{2}﹩ = 1.1. The black solid model shows the best-fit model from an equilibrium chemistry retrieval implemented using PetitRadtrans (P. Mollière et al. 2019) including an error inflation term. The details of the forward model are outlined in Section 4.3. The different color models show the effect of varying independent parameters in our forward model. We can rule out a low atmospheric metallicity (∼10), a supersolar C/O ratio (∼1), and a very low isothermal temperature (∼500 K) as they cannot match the CH4 and CO2 absorption features. The histograms in the lower panels show the posterior distributions of key retrieved parameters. The mean molecular weight is derived by postprocessing the metallicity and C/O posterior distributions. The best-fit parameters are shown in Table 3.
Other Images in This Article
Show More
Copyright and Terms & Conditions
© 2026. The Author(s). Published by the American Astronomical Society.