Image Details
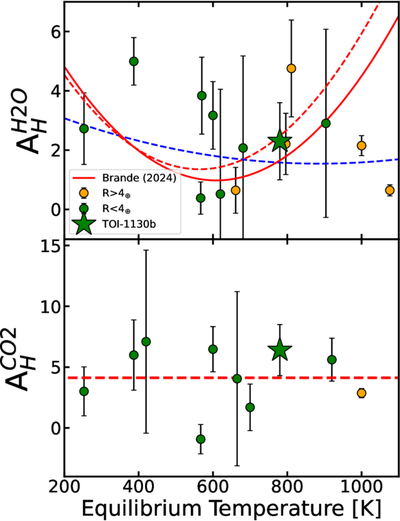
Caption: Figure 9.
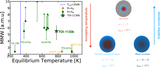
Scale height metric (Equation (5.3.3)) for mini- and super-Neptunes as a function of temperature. The upper panel is the water band at 1.4 μm and the lower panel is the CO2 band at 4.3 μm. We show TOI-1130 b in this diagram with ﹩{A}_{H}^{{{\rm{H}}}_{2}{\rm{O}}}=2.3\pm 1.3﹩ and ﹩{A}_{H}^{{{\rm{CO}}}_{2}}=6.4\pm 2.1﹩ assuming a μ of 5.5 amu. We overplot the tentative quadratic trend reported in J. Brande et al. (2024) for ﹩{A}_{H}^{{{\rm{H}}}_{2}{\rm{O}}}﹩ using only HST data (red solid line). We refit a quadratic function with the JWST data points included and it gives a trend consistent with J. Brande et al. (2024) if we do not include data points beyond 1000 K (red solid line). Including the two points after 1000 K finds a weaker quadratic fit (blue dashed line). The flat dashed line in the lower panel shows the best-fit flat line to the sample. The temperatures used in this plot have been calculated assuming an albedo of 0.3 and full recirculation. The data used to generate this figure are shown in Table D2.
Other Images in This Article
Show More
Copyright and Terms & Conditions
© 2026. The Author(s). Published by the American Astronomical Society.