Image Details
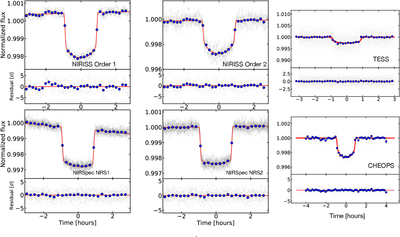
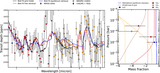
Caption: Figure 1.
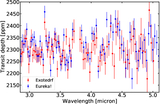
JWST white light curves, and phase-folded TESS and CHEOPS light curves of TOI-1130 b. The upper panel shows NIRISS/SOSS (order 1 on the left and order 2 on the right) and the lower panel shows NIRSpec/G395H light curves (NRS1 on the left and NRS2 on the right). The NIRISS data are reduced using exoTEDRF (M. Radica et al. 2025) and the NIRSpec light curves are reduced using Eureka! (T. Bell et al. 2022). The details of the data reduction are outlined in Section 3.1. The red solid lines show the best-fit models to the white light curves. The white light curve is fit using a batman model with a linear slope and quadratic limb darkening coefficients fixed from Exotic-LD (D. Grant & H. Wakeford 2024). We also show 10 minute binned light curves (blue circles). In the NIRISS/SOSS light curves we see a kink before the transit. In NRS1 we see a visit-long slope that has been seen in other observations (N. Espinoza et al. 2023). NRS2 does not show such a slope. We discuss the light-curve fitting methodology in detail in Section 3.2 The right upper panel shows the phase-folded TESS light curve and the lower right panel shows the phase-folded CHEOPS light curve. See Section 3.3 for details of the analysis.
Other Images in This Article
Show More
Copyright and Terms & Conditions
© 2026. The Author(s). Published by the American Astronomical Society.