Image Details
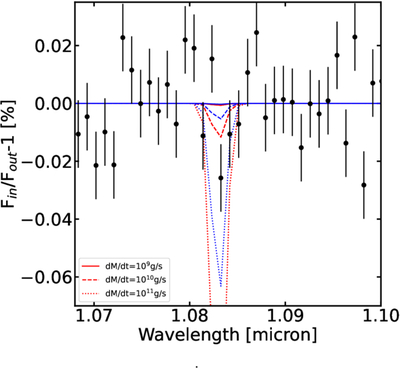
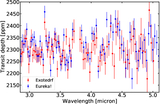
Caption: Figure 6.
We show the transmission spectrum of TOI-1130 b, zoomed in on the He triplet feature. We derive this spectrum using the formalism described in Section 4.6. The overplotted models have been calculated using the publicly available p-winds (L. A. Dos Santos et al. 2022) code. The red lines correspond to an upper atmosphere temperature of 8000 K and the blue lines correspond to 10,000 K models. The different line styles correspond to different mass-loss rates.
Other Images in This Article
Show More
Copyright and Terms & Conditions
© 2026. The Author(s). Published by the American Astronomical Society.
Copyright ©
2026 Astronomy Image Explorer. All Rights Reserved.