Image Details
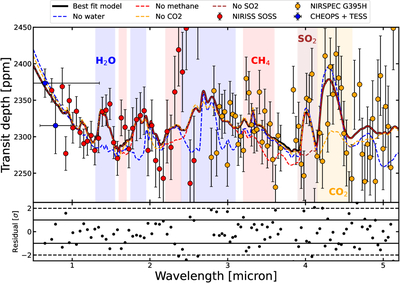
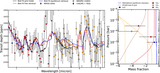
Caption: Figure 2.
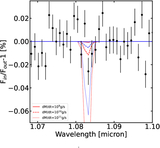
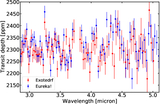
JWST/NIRSpec (orange) and NIRISS/SOSS (red) transmission spectrum of TOI-1130 b. The blue points show the transit depths derived from TESS and CHEOPS discussed in Section 3.3. The derivation of the JWST transmission spectra is discussed in Section 3.2. The error bars shown have been scaled up by the fitted jitter factor. The black solid model shows the best-fit model from a free chemistry retrieval (including error bar scaling) implemented using PetitRadtrans (P. Mollière et al. 2019). The best-fit model has a ﹩{\chi }_{\nu }^{2}﹩ = 1.01. The details of the forward model are outlined in Section 4.2. The different colored lines show models where one molecule has been removed from the best-fit model. The vertical dashed regions show the absorption regions corresponding to those molecules. We detect H2O (7.5σ), CO2 (3.3σ), and SO2 (3.6σ), and a tentative detection of CH4 (2σ). We calculate the detection significances by calculating the difference in χ2 from the best-fit model and a model where a particular molecule is removed. In Table 1 we show the χ2 values. The lower panel shows the residuals with respect to the best-fit model. Scaled up error bars have been used to calculate the residuals. The solid and dashed lines show the 1σ and 2σ confidence levels. The JWST/NIRSpec and NIRISS/SOSS spectra are available as the data behind the figure.
(The data used to create this figure are available in the online article.)
(The data used to create this figure are available.)
Other Images in This Article
Show More
Copyright and Terms & Conditions
© 2026. The Author(s). Published by the American Astronomical Society.