Image Details
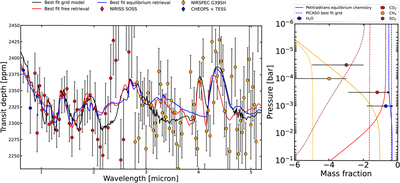
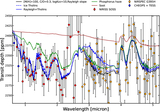
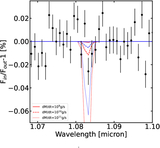
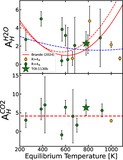
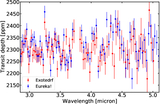
Caption: Figure 5.
Transmission spectrum of TOI-1130 b with the best-fit free chemistry, equilibrium chemistry, and grid models overplotted (left), and a comparison between the retrieved abundances from the three model fits for TOI-1130 b (right). The points shown in the right panel are the best-fit mass fractions from the free retrieval. The H2O and CO2 posterior distributions show lower limits, where as the other molecules show Gaussian distributions. Therefore the H2O and CO2 data points are shown with upper arrows. The solid lines show chemical abundance profiles from equilibrium chemistry and the dashed lines show the chemical profiles from the self-consistent forward model grid.
Other Images in This Article
Show More
Copyright and Terms & Conditions
© 2026. The Author(s). Published by the American Astronomical Society.