Image Details
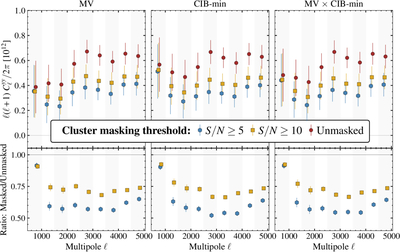
Caption: Figure 9.
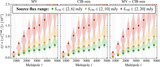
Changes to the measured tSZ power spectrum when clusters are masked in the analysis. The top panels show the actual values while the bottom panels show the ratio for different LC schemes. Red circles correspond to the baseline unmasked case, while the blue hexagons (yellow squares) correspond to masking clusters detected with S/N ≥ 5 (S/N ≥ 10) from the SPT cluster catalog (K. Kornoelje et al. 2025). The tSZ power reduces by ×1.8 and ×1.5 at ℓ = 3000 for the two masking schemes.
Other Images in This Article

Copyright and Terms & Conditions
© 2026. The Author(s). Published by the American Astronomical Society.
Copyright ©
2026 Astronomy Image Explorer. All Rights Reserved.