Image Details
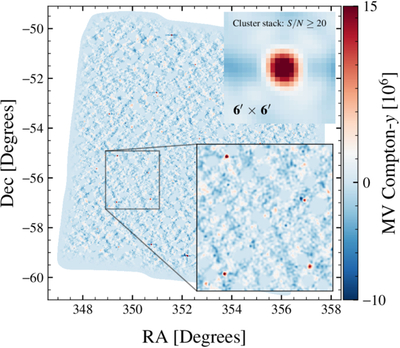
Caption: Figure 2.
MV Compton-y map created using the full dataset. The increments (red dots) correspond to the cluster locations, and the negative bowls around them correspond to the scan-direction filtering of the SPT maps, which we correct using TF during the power spectrum estimation stage. The inset panel in the top right shows the ﹩6^{\prime} \times 6^{\prime} ﹩ stack of clusters with S/N ≥ 20 from K. Kornoelje et al. (2025).
Other Images in This Article
Copyright and Terms & Conditions
© 2026. The Author(s). Published by the American Astronomical Society.
Copyright ©
2026 Astronomy Image Explorer. All Rights Reserved.