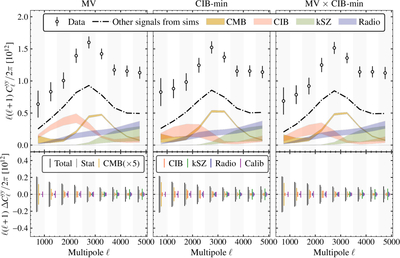
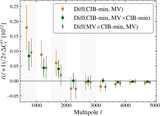
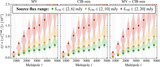
Image Details

Choose export citation format:

Measurement of the Full Shape of the Thermal Sunyaev–Zel’dovich Power Spectrum from the South Pole Telescope and Herschel–SPIRE Observations

  • Authors: S. Raghunathan, P. A. R. Ade, D. Anbajagane, A. J. Anderson, B. Ansarinejad, M. Archipley, J. E. Austermann, L. Balkenhol, D. R. Barron, P. S. Barry, J. A. Beall, K. Benabed, A. N. Bender, B. A. Benson, F. Bianchini, L. E. Bleem, J. Bock, S. Bocquet, F. R. Bouchet, L. Bryant, E. Camphuis, M. G. Campitiello, J. E. Carlstrom, J. Carron, C. L. Chang, P. Chaubal, H. C. Chiang, P. M. Chichura, A. Chokshi, T.-L. Chou, R. Citron, A. Coerver, C. Corbett Moran, T. M. Crawford, A. T. Crites, C. Daley, T. de Haan, K. R. Dibert, M. A. Dobbs, M. Doohan, A. Doussot, D. Dutcher, W. Everett, C. Feng, K. R. Ferguson, N. C. Ferree, K. Fichman, A. Foster, S. Galli, J. Gallicchio, A. E. Gambrel, A. K. Gao, R. W. Gardner, F. Ge, E. M. George, N. Goeckner-Wald, R. Gualtieri, F. Guidi, S. Guns, N. Gupta, N. W. Halverson, E. Hivon, A. Y. Q. Ho, G. P. Holder, W. L. Holzapfel, J. C. Hood, J. D. Hrubes, A. Hryciuk, N. Huang, J. Hubmayr, K. D. Irwin, T. Jhaveri, F. Kéruzoré, A. R. Khalife, L. Knox, M. Korman, K. Kornoelje, C.-L. Kuo, A. T. Lee, K. Levy, Y. Li, D. Li, A. E. Lowitz, A. Lowitz, C. Lu, G. P. Lynch, T. J. Maccarone, A. S. Maniyar, E. S. Martsen, J. J. McMahon, F. Menanteau, M. Millea, J. Montgomery, Y. Nakato, T. Natoli, J. P. Nibarger, G. I. Noble, V. Novosad, Y. Omori, A. Ouellette, S. Padin, Z. Pan, P. Paschos, S. Patil, K. A. Phadke, A. W. Pollak, K. Prabhu, C. Pryke, W. Quan, M. Rahimi, A. Rahlin, C. L. Reichardt, M. Rouble, J. E. Ruhl, B. R. Saliwanchik, K. K. Schaffer, E. Schiappucci, C. Sievers, A. C. Silva Oliveira, A. Simpson, G. Smecher, J. A. Sobrin, A. A. Stark, J. Stephen, C. Tandoi, B. Thorne, C. Trendafilova, C. Tucker, C. Umilta, T. Veach, J. D. Vieira, A. G. Vieregg, M. P. Viero, A. Vitrier, Y. Wan, G. Wang, N. Whitehorn, W. L. K. Wu, V. Yefremenko, M. R. Young, J. A. Zebrowski, M. Zemcov

S. Raghunathan et al 2026 The Astrophysical Journal Letters 1002 .

  • Provider: AAS Journals

Caption: Figure 3.

The total measured power spectra from data are shown as open circles in top panels for MV (left), CIB-min (middle), and the cross spectrum between the two (right). The dashed–dotted line corresponds to the expectation spectra of the undesired components, with the individual contributions shown in different colors: CMB in yellow, CIB in red, kSZ in green, and radio in blue. The dashed–dotted curve does not have the tSZ contribution, so it is not expected to align with the data points. The bands correspond to the systematic scatter in each component (see the Appendix for details). The error budgets (black) are presented in the bottom panels and have been decomposed into statistical (gray) and systematic errors from the undesired signals and calibration uncertainties (all other colors).

Other Images in This Article
Copyright and Terms & Conditions

Additional terms of reuse