Image Details
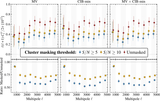
Caption: Figure 10.
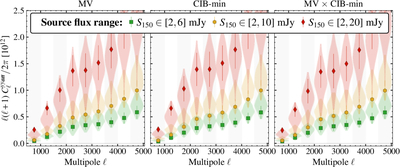
Power spectra of the difference maps ﹩{C}_{\ell }^{y{y}_{{\bf{diff}}}}﹩ computed by subtracting the baseline case of S150 = 2 mJy from the maps made with other source masking schemes: S150 = 6 mJy (green), S150 = 10 mJy (yellow), and S150 = 20 mJy (red). The violins show the scatter from simulations, which include both the statistical and the systematic errors from radio sources. The simulations used are CMB + kSZ + tSZ + Uncorr-CIB + Uncorr-radio, and do not contain correlation between tSZ and bright sources. The observed differences are consistent within the errors, which increase significantly with the masking threshold due to the residual radio power, and we do not observe a significant correlation between tSZ and bright point sources detected in our survey footprint.
Other Images in This Article

Copyright and Terms & Conditions
© 2026. The Author(s). Published by the American Astronomical Society.