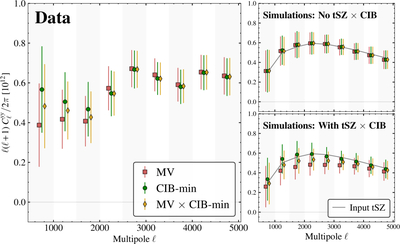
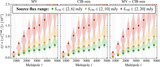
Image Details

Choose export citation format:

Measurement of the Full Shape of the Thermal Sunyaev–Zel’dovich Power Spectrum from the South Pole Telescope and Herschel–SPIRE Observations

  • Authors: S. Raghunathan, P. A. R. Ade, D. Anbajagane, A. J. Anderson, B. Ansarinejad, M. Archipley, J. E. Austermann, L. Balkenhol, D. R. Barron, P. S. Barry, J. A. Beall, K. Benabed, A. N. Bender, B. A. Benson, F. Bianchini, L. E. Bleem, J. Bock, S. Bocquet, F. R. Bouchet, L. Bryant, E. Camphuis, M. G. Campitiello, J. E. Carlstrom, J. Carron, C. L. Chang, P. Chaubal, H. C. Chiang, P. M. Chichura, A. Chokshi, T.-L. Chou, R. Citron, A. Coerver, C. Corbett Moran, T. M. Crawford, A. T. Crites, C. Daley, T. de Haan, K. R. Dibert, M. A. Dobbs, M. Doohan, A. Doussot, D. Dutcher, W. Everett, C. Feng, K. R. Ferguson, N. C. Ferree, K. Fichman, A. Foster, S. Galli, J. Gallicchio, A. E. Gambrel, A. K. Gao, R. W. Gardner, F. Ge, E. M. George, N. Goeckner-Wald, R. Gualtieri, F. Guidi, S. Guns, N. Gupta, N. W. Halverson, E. Hivon, A. Y. Q. Ho, G. P. Holder, W. L. Holzapfel, J. C. Hood, J. D. Hrubes, A. Hryciuk, N. Huang, J. Hubmayr, K. D. Irwin, T. Jhaveri, F. Kéruzoré, A. R. Khalife, L. Knox, M. Korman, K. Kornoelje, C.-L. Kuo, A. T. Lee, K. Levy, Y. Li, D. Li, A. E. Lowitz, A. Lowitz, C. Lu, G. P. Lynch, T. J. Maccarone, A. S. Maniyar, E. S. Martsen, J. J. McMahon, F. Menanteau, M. Millea, J. Montgomery, Y. Nakato, T. Natoli, J. P. Nibarger, G. I. Noble, V. Novosad, Y. Omori, A. Ouellette, S. Padin, Z. Pan, P. Paschos, S. Patil, K. A. Phadke, A. W. Pollak, K. Prabhu, C. Pryke, W. Quan, M. Rahimi, A. Rahlin, C. L. Reichardt, M. Rouble, J. E. Ruhl, B. R. Saliwanchik, K. K. Schaffer, E. Schiappucci, C. Sievers, A. C. Silva Oliveira, A. Simpson, G. Smecher, J. A. Sobrin, A. A. Stark, J. Stephen, C. Tandoi, B. Thorne, C. Trendafilova, C. Tucker, C. Umilta, T. Veach, J. D. Vieira, A. G. Vieregg, M. P. Viero, A. Vitrier, Y. Wan, G. Wang, N. Whitehorn, W. L. K. Wu, V. Yefremenko, M. R. Young, J. A. Zebrowski, M. Zemcov

S. Raghunathan et al 2026 The Astrophysical Journal Letters 1002 .

  • Provider: AAS Journals

Caption: Figure 5.

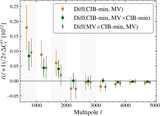
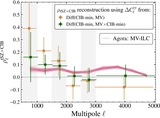
Reconstructed tSZ power spectra measured from data (left) and simulations (right): MV (red squares), CIB-min (green circles), and their cross spectrum (yellow diamonds). Left panel: in data, the tSZ power spectrum is measured at ∼9.3σ in all three cases. At  ≳ 2500, we find excellent agreement between all three spectra. The differences at lower multipoles are due to the different levels of tSZ × CIB, which results in a partial cancellation of the recovered tSZ signal. Right panels: The input tSZ power spectrum in the simulations is shown as the solid gray curve. The top-right panel corresponds to AGORA simulations with all the components but after explicitly removing the tSZ × CIB using (CMB + kSZ + tSZ + Uncorr-CIB + Uncorr-radio). In the absence of tSZ × CIB, all of the estimators return unbiased results. The bottom-right panel contains tSZ × CIB, and in this case, we find the MV estimate to be biased low at large scales. The CIB-min remains unbiased, and MV × CIB-min lies in between the two. The simulation’s results are obtained after averaging over 25 realizations. This trend is similar between data and simulations, although unlike in the empirical data, the simulations show that MV remains biased even at small scales. This is due to the differences in tSZ × CIB between data and simulations. The bottom-right panel is provided solely for illustration to build intuition about how the tSZ × CIB can bias the tSZ power spectrum, and we emphasize that we do not rely on tSZ × CIB in simulations for any part of our analysis.

Other Images in This Article
Copyright and Terms & Conditions

Additional terms of reuse