Image Details
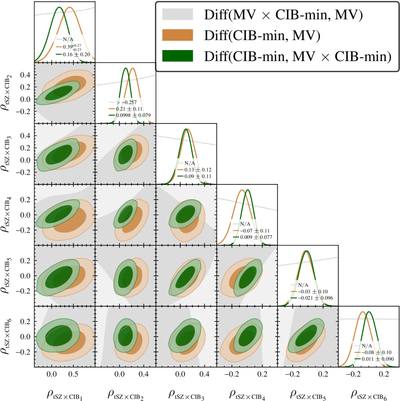
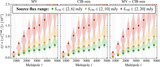
Caption: Figure 8.
Full corner plot showing the correlations between ﹩{\rho }_{\ell }^{{\rm{tSZ}}}\times {\rm{CIB}}﹩ in the six bins shown in Figure 7. The colors follow the same scheme as Figures 6 and 7. For completeness, we also include in gray the results from the difference test of (MV × CIB-min, MV); however, this test provides no additional constraining power.
Other Images in This Article

Copyright and Terms & Conditions
© 2026. The Author(s). Published by the American Astronomical Society.
Copyright ©
2026 Astronomy Image Explorer. All Rights Reserved.