Image Details
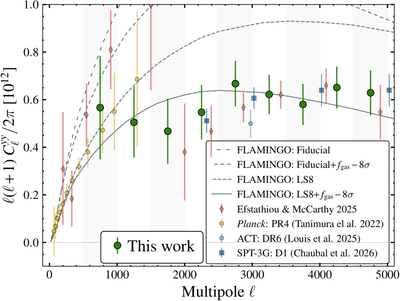
Caption: Figure 4.
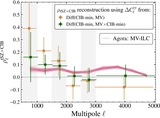
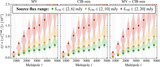
The tSZ power spectra measured at 9.3σ using the CIB-min maps is shown in green. The error bars include contributions from both statistical and systematic errors, and have significant off-diagonal correlations due to the non-Gaussian nature of the signals. We also show the results from Planck (PR4) as yellow hexagons; ACT (DR6) as a teal octagon; SPT-3G (D1) as blue squares; and a joint analysis of ACT, Planck, and SPT as red diamonds. While the results in this work are slightly higher than ACT at ℓ = 3000 by 1σ, we find excellent agreement with Planck in the overlapping scales and also with the results from SPT-3G and G. Efstathiou & F. McCarthy (2025) over a wide range of scales. For reference, we also show the power spectra from versions of the FLAMINGO simulations as gray curves with different spacings. The curve with the widest spacing corresponds to the simulation with the fiducial cosmology and fiducial active galactic nucleus (AGN) feedback. The next curve (with slightly smaller spacing) shows the same cosmology but with high AGN feedback (fgas − 8σ). This is followed by the low S8 (LS8) cosmology with fiducial feedback and finally the model combining low S8 with high AGN feedback (LS8+fgas − 8σ).
Other Images in This Article

Copyright and Terms & Conditions
© 2026. The Author(s). Published by the American Astronomical Society.