Image Details
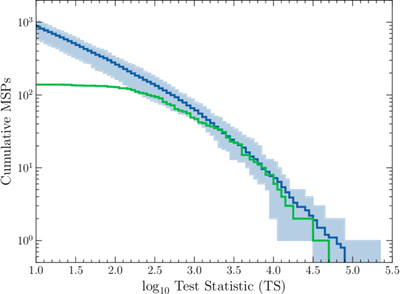
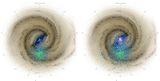
Caption: Figure 4.
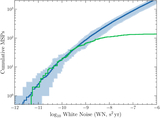
As in Figure 3, the blue trace and envelope give the mean and range over 10 MSP population realizations of the statistical significance as estimated with the calibrated TS described in the main text. The green trace again gives the distribution of observed values, with a turnover indicating the effective LAT sample threshold. Both distributions have been scaled to a dataset length of 12 yr.
Other Images in This Article
Copyright and Terms & Conditions
© 2026. The Author(s). Published by the American Astronomical Society.
Copyright ©
2026 Astronomy Image Explorer. All Rights Reserved.