Image Details
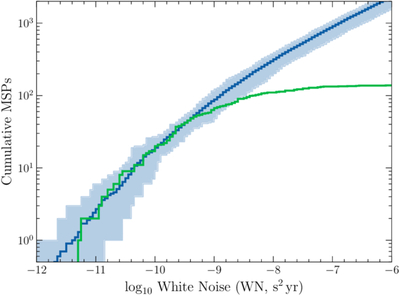
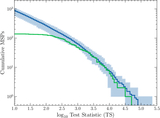
Caption: Figure 5.
Distribution of WN (essentially pulsar timing precision) for 10 realizations of the disk MSP population in the virtual LAT. As in previous plots, the solid line indicates the mean, while the shaded region indicates the range of the simulations. The green trace gives the distribution of observed WN values.
Other Images in This Article
Copyright and Terms & Conditions
© 2026. The Author(s). Published by the American Astronomical Society.
Copyright ©
2026 Astronomy Image Explorer. All Rights Reserved.