Image Details
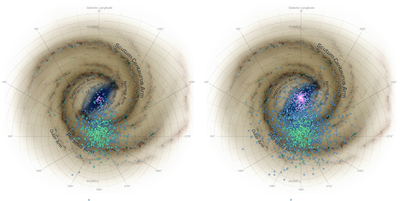
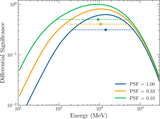
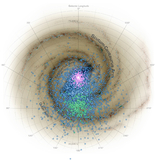
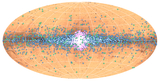
Caption: Figure 9.
Positions of detected, simulated MSPs in the Galaxy for C4 and C5 (see Table 1), which have AΩ = 10 × the LAT and PSF widths 1 × and 1/3 × , respectively. The green points are MSPs detectable by the LAT-like C1 and are all in the disk. The blue points indicate detected disk MSPs, and the lilac points indicate bulge MSPs under S3. The impact of the improved PSF for detecting MSPs in high background regions (distant MSPs in the disk; near the Galactic center) is evident. Background image credit: NASA/JPL-Caltech/R. Hurt (SSC/Caltech).
Other Images in This Article
Copyright and Terms & Conditions
© 2026. The Author(s). Published by the American Astronomical Society.
Copyright ©
2026 Astronomy Image Explorer. All Rights Reserved.