Image Details
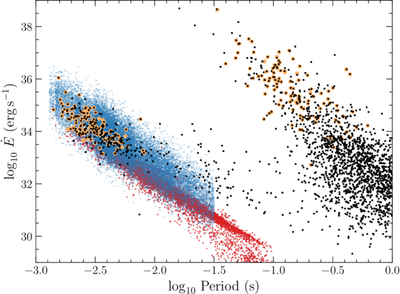
Caption: Figure 1.
The distribution in P and ﹩\dot{E}﹩ for various populations of field MSPs (lower left) and young pulsars (upper right, shown for completeness). The black points are field pulsars—excluding globular clusters—tabulated in the ATNF pulsar catalog (R. N. Manchester et al. 2005; http://www.atnf.csiro.au/research/pulsar/psrcat), and the orange points are LAT-detected pulsars. The blue points are one realization of the disk population of MSPs (S1), while the red points correspond to a simulated bulge population of MSPs formed via AIC (S2). The MSPs of a disklike bulge population, S3, follow the same distribution as S1, so they are not shown again. The period cutoffs of 30 ms (S1/S3) and 100 ms (S2) that were assumed in the synthesis are evident, but these cutoffs are irrelevant for PTAs, which prioritize rapid rotators.
Other Images in This Article
Copyright and Terms & Conditions
© 2026. The Author(s). Published by the American Astronomical Society.