Image Details
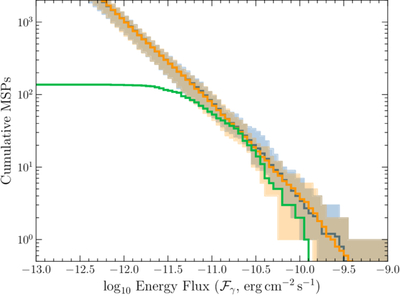
Caption: Figure 3.
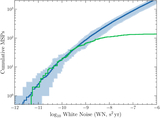
Cumulative distribution of γ-ray fluxes observed at Earth as predicted from the FP relation for 10 synthesized MSP populations. The blue trace indicates the mean over the realizations and includes additional scatter in Ec and ﹩{{ \mathcal L }}_{\gamma }﹩, while the orange trace gives the results without this scatter. The envelope of the same color indicates the minimum and maximum values encountered over the 10 realizations. The green trace is the observed flux distribution of LAT MSPs.
Other Images in This Article
Copyright and Terms & Conditions
© 2026. The Author(s). Published by the American Astronomical Society.
Copyright ©
2026 Astronomy Image Explorer. All Rights Reserved.