Image Details
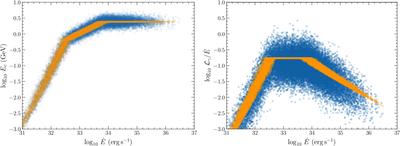
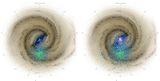
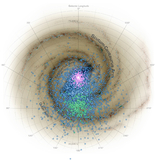
Caption: Figure 2.
Predicted cutoff energy (Ec, left) and γ-ray efficiency (right) distributions for one realization of the disk population (S1), showing three regimes. The orange points indicate the direct application of the relation to the synthesized P and ﹩\dot{P}﹩, and the blue points indicate the introduction of scatter on both Ec and ﹩{{ \mathcal L }}_{\gamma }﹩. The former captures the observed observational spread in Ec, and the latter captures beaming and other neglected physical influences on the luminosity/flux (e.g., magnetic inclination).
Other Images in This Article
Copyright and Terms & Conditions
© 2026. The Author(s). Published by the American Astronomical Society.
Copyright ©
2026 Astronomy Image Explorer. All Rights Reserved.