Image Details
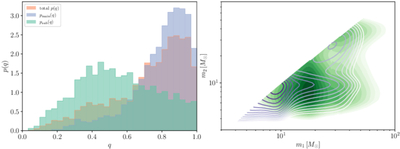
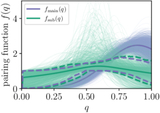
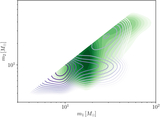
Caption: Figure 9.
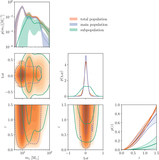
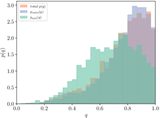
Mass ratio (left panel) and two-dimensional mass (right panel) distributions for the main population and subpopulation in the case where the pairing function is allowed to differ between the main population and subpopulation. All distributions are averaged over population-level uncertainty and colors are the same as in all previous figures.
Other Images in This Article
Show More
Copyright and Terms & Conditions
© 2026. The Author(s). Published by the American Astronomical Society.
Copyright ©
2026 Astronomy Image Explorer. All Rights Reserved.