Image Details
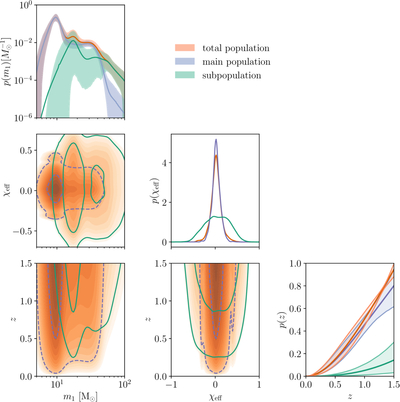
Caption: Figure 4.
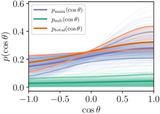
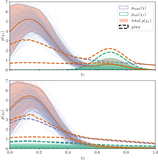
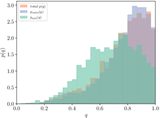
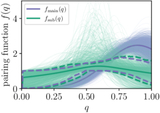
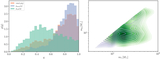
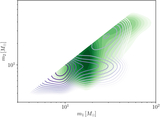
Population-level correlations caused by hierarchical mergers. Diagonal panels show the inferred one-dimensional mass, effective spin, and redshift distributions of the main population (violet), 2G+1G subpopulation (green), and combined, or total population (orange). These are marginalized over all other dimensions. Off-diagonal panels show filled contours of the total population in orange, with locations of the main population and subpopulation contributions indicated with unfilled dashed and solid contours, respectively. All two-dimensional contours show hyperposterior-averaged distributions, while the one-dimensional mass and redshift distributions show hyperposterior uncertainty as shaded bands. Correlations can be observed between all parameters shown: the high-mass tail of the population increases with redshift, the effective spin distribution broadens with redshift, and the effective spin distribution modulates with mass.
Other Images in This Article
Show More
Copyright and Terms & Conditions
© 2026. The Author(s). Published by the American Astronomical Society.