Image Details
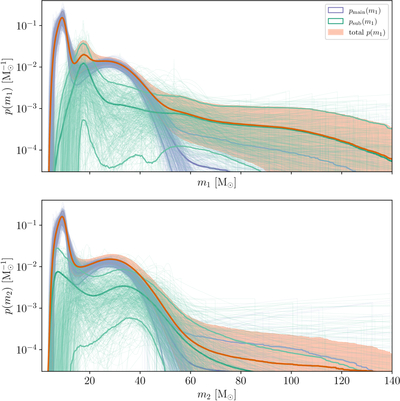
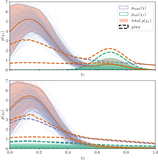
Caption: Figure 2.
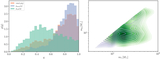
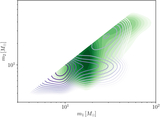
Inferred primary (top panel) and secondary (bottom panel) mass distributions for the hierarchically merged subpopulation (green) and main population (violet), after a pairing function is removed. The primary mass distribution of the subpopulation peaks at roughly twice the value of its secondary mass distribution’s mode. Additionally, only the subpopulation’s primary mass distribution contributes significantly to the merger rate at high masses. These two facts imply that the χ1 ≈ 0.7 subpopulation is primarily made up of 2G+1G mergers, whereas 1G+1G mergers (originating either in star clusters or in the galactic field) constitute the main population. It is therefore possible to interpret the subpopulation’s primary and secondary mass distributions as the distributions of 2G and 1G BHs in clusters, respectively.
Other Images in This Article
Show More
Copyright and Terms & Conditions
© 2026. The Author(s). Published by the American Astronomical Society.