Image Details
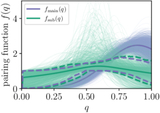
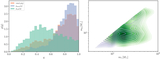
Caption: Figure 3.
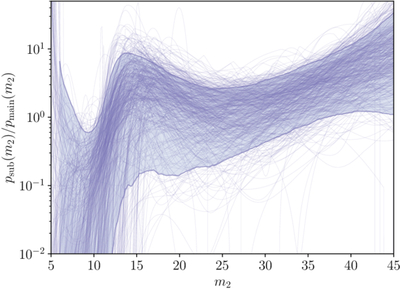
Ratio of the subpopulation’s 1G mass distribution, representing 1G BHs that merge in clusters, to the main population’s mass distribution, which consists of 1G BHs in clusters as well as all other binary formation scenarios. Horizontal lines on this plot would indicate that all BBHs originate in the same population of star clusters that produce 2G+1G mergers. However, a noticeable dip is present at ≈9M⊙, implying either that isolated binary evolution is required to fully explain the feature there, or that the clusters that produce our observed 1G+1G mergers differ from those that produce the 2G+1G population.
Other Images in This Article
Show More
Copyright and Terms & Conditions
© 2026. The Author(s). Published by the American Astronomical Society.