Image Details
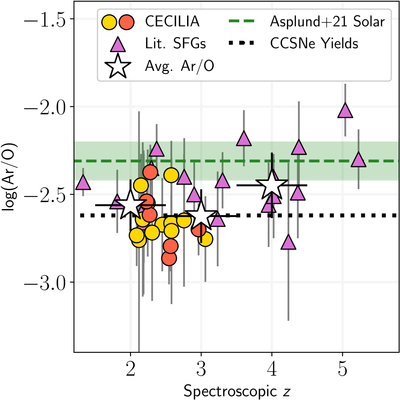
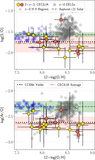
Caption: Figure 9.
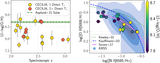
The redshift evolution of the relative Ar/O abundance in SFGs observed with JWST. The chemical abundance patterns in the literature galaxies (purple triangles) are taken directly from B. Welch et al. (2024, 2025), T. Morishita et al. (2025), T. M. Stanton et al. (2025), and S. Bhattacharya et al. (2025a). The color of the CECILIA galaxies represents the number of direct Te measurements; see Figure 6. The average Ar/O ratios are measured in three redshift bins (1.5 ≤ z < 2.5, 2.5 ≤ z < 3.5, and 3.5 ≤ z < 4.5) and plotted as white stars. The SFGs at 2 < z < 3.1 indicate that the gas-phase Ar/O abundance reaches (Ar/O) = 0.56 ± 0.05 × (Ar/O)⊙, similar to the CCSN yield predictions plotted in dotted black.
Other Images in This Article
Show More
Copyright and Terms & Conditions
© 2026. The Author(s). Published by the American Astronomical Society.