Image Details
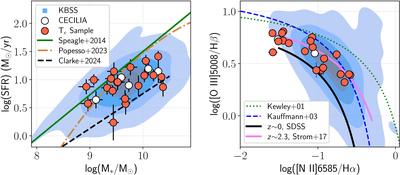
Caption: Figure 3.
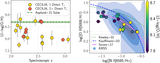
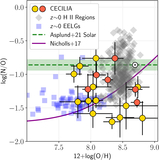
General properties of CECILIA and KBSS, the CECILIA galaxies’ parent sample. Left: the SFMS, log(SFR) vs. log(M*). The SFMS observed in KBSS is represented in blue contours (at 5%, 25%, 50%, 75%, and 95% densities), the CECILIA galaxies are denoted with white circles, and red circles represent the subsample of galaxies with at least one direct Te. We also provide fits to the SFMS from J. S. Speagle et al. (2014; at z = 2.5), P. Popesso et al. (2023; at z = 2.5), and L. Clarke et al. (2024; at 1.4 < z ≤ 2.7) as solid green, dotted–dashed brown, and dashed black lines, respectively. The Te sample presented here is representative of both the average properties of KBSS and typical galaxies at Cosmic Noon. Right: the N2-BPT, log([O III]/Hβ) vs. log([N II]/Hα). The ratios plotted on the horizontal axis are measured from NIRSpec. [O III]/Hβ is measured from NIRSpec when available; otherwise, this ratio is measured from the archival MOSFIRE data. The green dotted and blue dashed lines represent the L. J. Kewley et al. (2001) and G. Kauffmann et al. (2003) demarcations for the line ratios predicted from an extreme starburst and AGN ionization, respectively. The line ratios measured in KBSS are represented as the blue contours, and the average trend derived by A. L. Strom et al. (2017) is plotted in solid pink. The average N2-BPT line ratio trend for z ∼ 0 SFGs in SDSS is plotted as a black line. The Te sample spans almost 1 dex in [N II]/Hα and follows the ionization trends predicted from the full KBSS sample.
Other Images in This Article
Show More
Copyright and Terms & Conditions
© 2026. The Author(s). Published by the American Astronomical Society.