Image Details
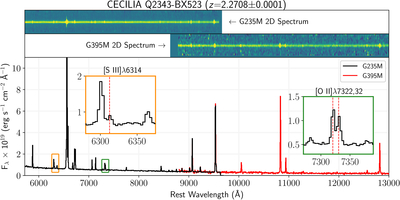
Caption: Figure 1.
NIRSpec spectrum of BX523, an SFG at z = 2.2708 ± 0.0001 in the CECILIA sample. The top two panels plot the 2D spectra from each grating, where the global background and bar shadow removal procedures have resulted in a featureless background with no self-subtraction in the strong emission lines. The optimally extracted 1D spectra, shifted to the rest-frame of BX523, are plotted in the main panel. The G235M spectrum (black) has been resampled to match the G395M data (red) for plotting purposes only. We highlight the high-S/N detections of the [S III] λ6314 and [O II] λλ7322, 7332 Te-sensitive auroral lines in the inset panels (plotted at the native sampling of G235M). The depth of the CECILIA observations reveals many other faint emission lines in both the 2D and 1D spectra.
Other Images in This Article
Show More
Copyright and Terms & Conditions
© 2026. The Author(s). Published by the American Astronomical Society.