Image Details
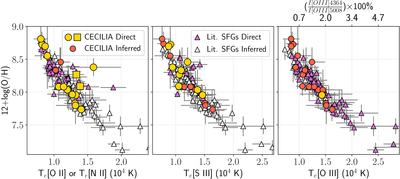
Caption: Figure 7.
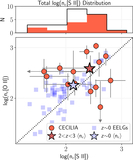
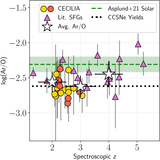
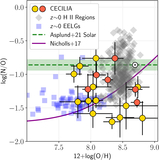
Direct 12 + log(O/H) measured in galaxies at z > 1.3 are plotted against Te[O II] or Te[N II] when available (left), Te[S III] (middle), and Te[O III] (right). The shapes represent whether the Te in each panel are directly measured or inferred from a Te scaling relation: yellow circles are direct Te measurements from CECILIA (yellow squares represent direct Te[N II]); red circles are CECILIA galaxies with inferred Te; purple and white triangles are literature SFGs where the specific Te has been directly measured and inferred, respectively. The expected anticorrelation between O/H and Te is observed, and the CECILIA galaxies with low direct Te[O II] and Te[S III] extend the trend to the highest O/H. Above the right panel, we provide the auroral-to-nebular [O III] line ratio required to produce the direct or inferred Te. Few high-z galaxies have [O III] auroral-to-nebular line ratios ≤0.007 predicted in the most metal-rich CECILIA galaxies.
Other Images in This Article
Show More
Copyright and Terms & Conditions
© 2026. The Author(s). Published by the American Astronomical Society.