Image Details
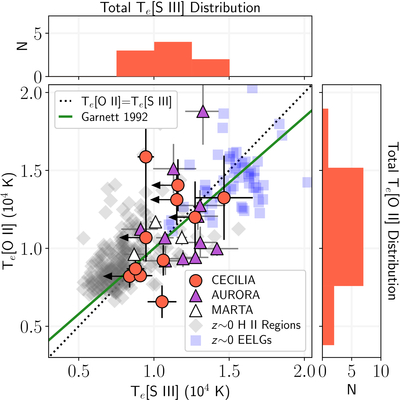
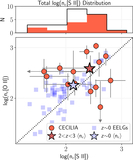
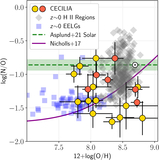
Caption: Figure 5.
Simultaneous Te[O II] and Te[S III] measured in the CECILIA sample (red circles; 3σ Te[S III] upper limits provided with black arrows), local EELGs (blue squares), and the metal-rich CHAOS H II regions (gray diamonds). We also include direct Te from the AURORA (R. L. Sanders et al. 2025b) and MARTA surveys (E. Cataldi et al. 2025; M. Curti et al. 2025a) as purple and white triangles, respectively. The theoretical Te scaling relation from D. R. Garnett (1992) is plotted in green, while the black dotted line indicates equivalent Te[O II] and Te[S III]. The histogram distributions of the 17 Te[O II] and 9 Te[S III] measurements in CECILIA are provided in the right and top panels, respectively. The high-z Te are generally consistent with those measured in the local Universe and from photoionization model predictions, but there are currently insufficient data to assess the scatter in Te[O II]–Te[S III] at high z.
Other Images in This Article
Show More
Copyright and Terms & Conditions
© 2026. The Author(s). Published by the American Astronomical Society.