Image Details
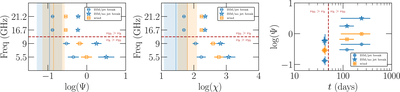
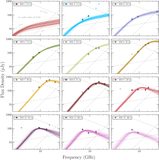
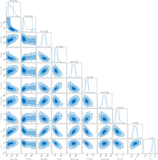
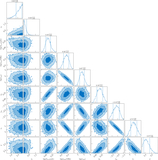
Caption: Figure 7.
Left: values for ﹩\mathrm{log}({\rm{\Psi }})﹩ for GRB 230815A as determined from the light-curve turnovers at 5.5, 9, 16.7, and 21.2 GHz. Middle: values for ﹩\mathrm{log}(\chi )﹩ for GRB 230815A as determined from the light-curve turnovers at 5.5, 9, 16.7, and 21.2 GHz. Right: values for ﹩\mathrm{log}({\rm{\Psi }})﹩ for GRB 230815A as a function of time in days postburst. For each panel, blue circular markers are used for measurements that assume an ISM environment and a jet break at 0.1 days postburst (corresponding to the X-ray jet break); blue star markers are used for measurements that assume an ISM environment and no jet break yet at 400 days postburst (corresponding to the observed radio behavior); and the orange square markers are used for measurements that assume a stellar wind environment. For the left and middle panels, the shaded regions correspond to the 1σ confidence intervals centered on the weighted averages (the solid vertical lines) of the Ψ and χ values, respectively, for the R. A. Duncan et al. (2023) sample in the ISM (blue) and stellar wind (orange) environments. The red dashed line in each panel represents where νm passes νa (see Section 3.4); this is likely responsible for the apparent evolution of the parameters.
Other Images in This Article
Show More
Copyright and Terms & Conditions
© 2026. The Author(s). Published by the American Astronomical Society.