Image Details
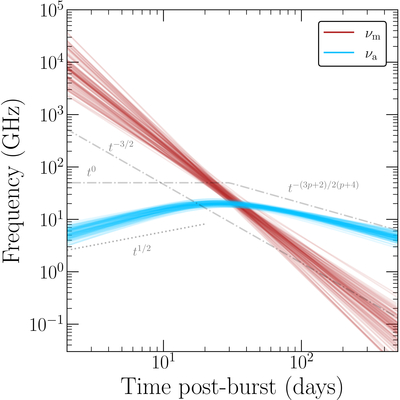
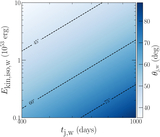
Caption: Figure 5.
Time evolution of the injection (νm; red lines) and self-absorption (νa; blue lines) frequencies from 100 random posterior samples of the evolving synchrotron spectrum model of Section 3.4. The gray dotted-dashed lines show the expected evolutions of the two frequencies in the self-similar phase of an R. D. Blandford & C. F. McKee (1976) blast wave (valid for a homogenous ISM environment), as given in J. Granot & R. Sari (2002), assuming p = 2.6. The dotted line shows t1/2, which approximates the initial evolution of νa.
Other Images in This Article
Show More
Copyright and Terms & Conditions
© 2026. The Author(s). Published by the American Astronomical Society.
Copyright ©
2026 Astronomy Image Explorer. All Rights Reserved.