Image Details
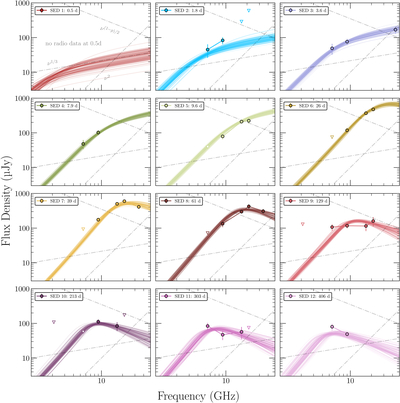
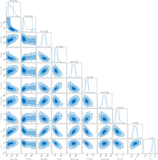
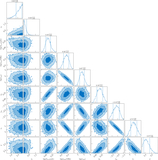
Caption: Figure 4.
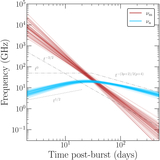
Radio SEDs of GRB 230815A at the 12 different epochs constructed from the temporal windows shown in Figure 2. The epoch is labeled in the legend for each panel. The dotted–dashed lines are guide lines showing different spectral slopes. These spectral slopes are labeled in SED 1 (0.5 days postburst), with p = 2.2 adopted here (see the text). Detections are shown with filled circular markers, while 3σ upper limits for nondetections are shown using inverted triangular markers. The thin lines in each panel show model spectra from 100 random posterior samples from the nested sampling procedure performed to constrain our evolving synchrotron model in Section 3.4.
Other Images in This Article
Show More
Copyright and Terms & Conditions
© 2026. The Author(s). Published by the American Astronomical Society.