Image Details
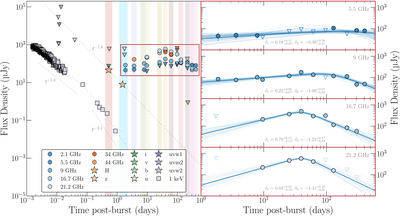
Caption: Figure 2.
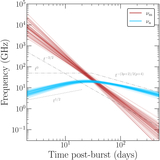
Left: multiwavelength light curves for GRB 230815A. The radio data points are represented with circular markers, the near-infrared data points are represented with star markers, and the X-ray data points are represented with square markers. All upper limits are shown with inverted triangular markers. The fits describing the evolution of the X-ray and near-infrared light curves are shown using dashed lines, with the corresponding temporal slopes annotated next to them. The radio data points surrounded by the red rectangle are shown in more detail in the right panel. The colored vertical strips indicate the temporal windows used for constructing the SEDs presented in Figures 3 and 4, where the color of each strip here corresponds to the SED of the same color in those figures. Right: radio light curves for GRB 230815A at 5.5, 9, 16.7, and 21.2 GHz (from top to bottom). Each detection is represented by a circular marker, and upper limits are represented with inverted triangular markers. At each frequency, the solid blue line represents the smoothly broken power-law fit (Model 1; independent δ1 and δ2 per frequency) to the light curve using the best-fit parameters estimated from nested sampling, while the 50 lines with weaker line intensity are random posterior samples used to illustrate the fit uncertainties.
Other Images in This Article
Show More
Copyright and Terms & Conditions
© 2026. The Author(s). Published by the American Astronomical Society.