Image Details
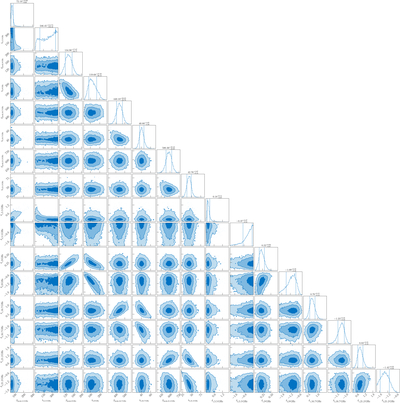
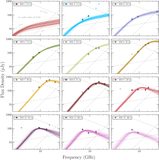
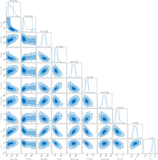
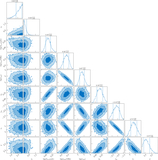
Caption: Figure A3.
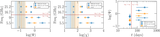
Posterior distributions of the parameters in the smoothly broken power-law model fit to the multifrequency radio light curves, assuming the rise and decay slopes (δ1 and δ2) are independent for each frequency (see Table 4). The dashed vertical lines on the histograms represent the 68% credible intervals of the corresponding marginalized posterior distributions. To help with readability, the parameters from left to right are: Speak,5.5 GHz, tb,5.5 GHz, Speak,9 GHz, tb,9 GHz, Speak,16.7 GHz, tb,16.7 GHz, Speak,21.2 GHz, tb,21.2 GHz, δ1,5.5 GHz, δ2,5.5 GHz, δ1,9 GHz, δ2,9 GHz, δ1,16.7 GHz, δ2,16.7 GHz, δ1,21.2 GHz, and δ2,21.2 GHz.
Other Images in This Article
Show More
Copyright and Terms & Conditions
© 2026. The Author(s). Published by the American Astronomical Society.